
Maple 2018 includes a new set of drawing tools so you can annotate images, generate diagrams, and more, all programmatically. These tools are in addition to the interactive drawing tools already available with the Drawing Canvas.
ImageTools:-Draw is a subpackage of ImageTools that provides primitives for drawing into an ImageTools:-Image. All primitives work in terms of continuous mathematical coordinates, not discrete pixels, and are rendered using anti-aliasing.
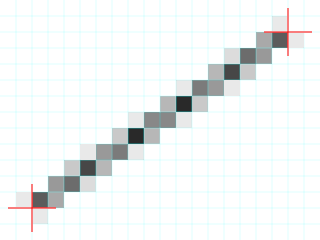
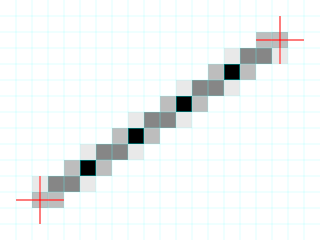
Line from (2.0,2.0) to (18.0,13.0), thickness=1: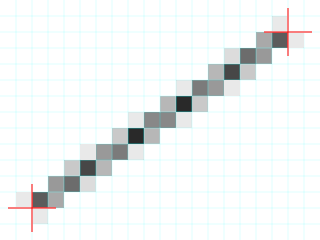
Line from (2.5,2.5) to (17.5,12.5), thickness=1: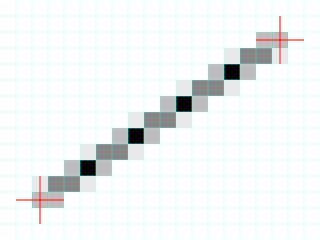
The correspondence between point coordinates [x,y] and Array indices [r,c] is given by:
c = x + 0.5
r = (H + 1) - (y + 0.5)
After first creating an image using ImageTools:-Create, or loading an image with ImageTools:-Read, drawing operations can be performed on it using a number of primitives (functions that draw one kind of object). The first argument to each primitive is the image itself, as returned by Create or Read.
Each primitive is a member of the ImageTools:-Draw package, and can be referenced by prefixing the primitive name with the package name (e.g., ImageTools:-Draw:-Poly), or using the bare primitive name in a context in which ImageTools:-Draw is in scope: after a call to with(ImageTools:-Draw), within a procedure having a uses ImageTools:-Draw clause, or within a use ImageTools:-Draw in ... end statement.
In addition to the drawing primitives any other command from the ImageTools package can be applied to the image at any time, so one can combine drawing operations with other image manipulation techniques.
The Poly primitive draws a multi-segment line (polyline) or closed shape (polygon) given a list, Array, or Matrix of points.
| > | with(ImageTools): |
| > | with(ImageTools:-Draw): |
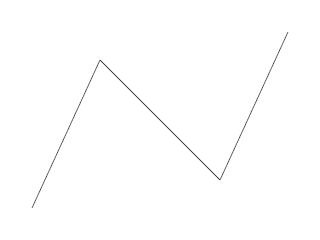
Thin polyline.
| > | img := Create(240,320,channels=3,background=white): |
| > | Poly(img,[[32,32],[100,180],[220,60],[288,208]],color=0.25); |
| > | Embed(img); |
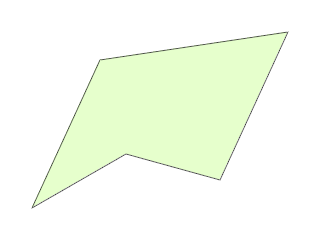
Filled polygon.
| > | img := Create(240,320,channels=3,background=white): |
| > | Poly(img,[[32,32],[100,180],[288,208],[220,60],[126,86],[32,32]],
color=0.25,thickness=1,round=true,pattern="solid", fill_color=[0.9,1,0.8],fill_pattern="solid"); |
| > | Embed(img); |
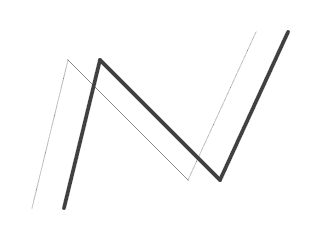
Very thin and thick polylines.
| > | img := Create(240,320,channels=3,background=white): |
| > | Poly(img,[[32,32],[68,180],[188,60],[256,208]],
color=0.25,thickness=0.5,round=true); |
| > | Poly(img,[[64,32],[100,180],[220,60],[288,208]],
color=0.25,thickness=4,round=true); |
| > | Embed(img); |
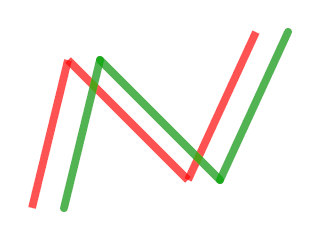
Round vs. square segment ends, and color transparency.
| > | img := Create(240,320,channels=3,background=white): |
| > | Poly(img,[[32,32],[68,180],[188,60],[256,208]],
color=[1,0,0,0.9],thickness=8,round=false); |
| > | Poly(img,[[64,32],[100,180],[220,60],[288,208]],
color=[0,0.66,0,0.9],thickness=8,round=true); |
| > | Embed(img); |
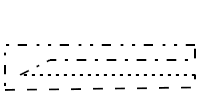
Polyline pattern examples.
| > | img := Create(100,200,channels=3,background=white): |
| > | Poly(img,[[5,10],[195,12.5],[195,25]],color=0,thickness=2,pattern="dash"); |
| > | Poly(img,[[195,25],[195,25],[20,25]],color=0,thickness=2,pattern="dot"); |
| > | Poly(img,[[20,25],[50,40],[195,40],[195,55]],color=0,thickness=2,pattern="dashdot"); |
| > | Poly(img,[[195,55],[5,55],[5,10]],color=0,thickness=2,pattern="dashdotdot"); |
| > | Embed(img); |
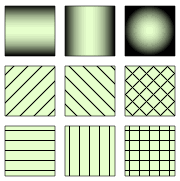
Fill pattern examples.
| > | img := Create(240,180,channels=3,background=white): |
| > | Poly(img,[[5,5],[55,5],[55,55],[5,55],[5,5]],
color=0,fill_color=[0.9,1,0.8],fill_pattern="horizontal"); |
| > | Poly(img,[[65,5],[115,5],[115,55],[65,55],[65,5]],
color=0,fill_color=[0.9,1,0.8],fill_pattern="vertical"); |
| > | Poly(img,[[125,5],[175,5],[175,55],[125,55],[125,5]],
color=0,fill_color=[0.9,1,0.8],fill_pattern="cross"); |
| > | Poly(img,[[5,65],[55,65],[55,115],[5,115],[5,65]],
color=0,fill_color=[0.9,1,0.8],fill_pattern="forward"); |
| > | Poly(img,[[65,65],[115,65],[115,115],[65,115],[65,65]],
color=0,fill_color=[0.9,1,0.8],fill_pattern="backward"); |
| > | Poly(img,[[125,65],[175,65],[175,115],[125,115],[125,65]],
color=0,fill_color=[0.9,1,0.8],fill_pattern="diagonalCross"); |
| > | Poly(img,[[5,125],[55,125],[55,175],[5,175],[5,125]],
color=0,fill_color=[0.9,1,0.8],fill_pattern="horizontalCylinder"); |
| > | Poly(img,[[65,125],[115,125],[115,175],[65,175],[65,125]],
color=0,fill_color=[0.9,1,0.8],fill_pattern="verticalCylinder"); |
| > | Poly(img,[[125,125],[175,125],[175,175],[125,175],[125,125]],
color=0,fill_color=[0.9,1,0.8],fill_pattern="sphere"); |
| > | Embed(img); |
The Line primitive draws a straight line between two specified points. The same result can be achieved using the Poly primitive with a list of two points, except that the line primitive also has the ability to draw tapered lines.
| > | with(ImageTools): |
| > | with(ImageTools:-Draw): |
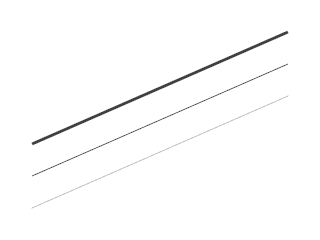
Lines of different thicknesses.
| > | img := Create(240,320,channels=3,background=white): |
| > | Line(img,32,32,288,144,color=0.25,thickness=0.5); |
| > | Line(img,32,64,288,176,color=0.25,thickness=1); |
| > | Line(img,32,96,288,208,color=0.25,thickness=3); |
| > | Embed(img); |
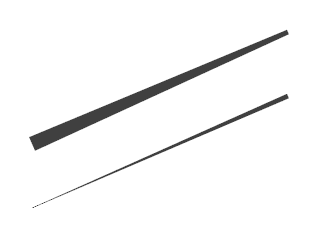
Tapered lines.
| > | img := Create(240,320,channels=3,background=white): |
| > | Line(img,32,32,288,144,color=0.25,thickness=[0.5,5]); |
| > | Line(img,32,96,288,208,color=0.25,thickness=[15,5]); |
| > | Embed(img); |
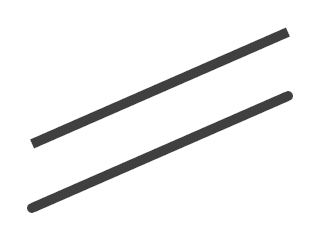
Round vs. square line ends.
| > | img := Create(240,320,channels=3,background=white): |
| > | Line(img,32,32,288,144,color=0.25,thickness=10,round=true); |
| > | Line(img,32,96,288,208,color=0.25,thickness=10,round=false); |
| > | Embed(img); |
Supporting Functions for the Examples
Draw a red cross hair centered at (xscale,yscale).
| > | crossHair := proc( img :: Array, x :: numeric, y :: numeric, scale :: numeric )
uses ImageTools:-Draw; Line(img,(x-1.5)*scale,y*scale,(x+1.5)*scale,y*scale, color="red",thickness=1.5); Line(img,x*scale,(y-1.5)*scale,x*scale,(y+1.5)*scale, color="red",thickness=1.5) end: |
Draw a background grid with specified interval.
| > | gridFill := proc( img :: Array, interval :: numeric )
local x, y, w, h; uses ImageTools:-Draw; w, h := Width(img), Height(img); for x from interval by interval while x < w do Line(img,x,0,x,h,color=[0,1,1,0.25]) od; for y from interval by interval while y < h do Line(img,0,y,w,y,color=[0,1,1,0.25]) od end: |
Zoomed image of anti-aliased line with integer endpoints.
| > | img := Create(15,20,channels=3,background=white): |
| > | Line(img,2,2,18,13,color=0); |
| > | img := Scale(img,16,method=nearest): |
| > | gridFill(img,16); |
| > | crossHair(img,2,2,16); |
| > | crossHair(img,18,13,16); |
| > | Embed(img); |
Zoomed image of anti-aliased line with non-integer endpoints.
| > | img := Create(15,20,channels=3,background=white): |
| > | Line(img,2.5,2.5,17.5,12.5,color=0); |
| > | img := Scale(img,16,method=nearest): |
| > | gridFill(img,16); |
| > | crossHair(img,2.5,2.5,16); |
| > | crossHair(img,17.5,12.5,16); |
| > | Embed(img); |
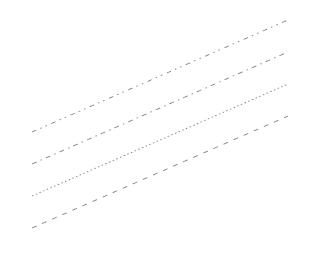
Line pattern examples.
| > | img := Create(260,320,channels=3,background=white): |
| > | Line(img,32,32,288,144,pattern="dash"); |
| > | Line(img,32,64,288,176,pattern="dot"); |
| > | Line(img,32,96,288,208,pattern="dashdot"); |
| > | Line(img,32,128,288,240,pattern="dashdotdot"); |
| > | Embed(img); |
The SolidRectangle primitive draws a rectangle whose boundaries fall (perceptually) on the mathematical rectangle specified by two opposing corners. This differs from using the Poly primitive with matching line color and solid fill pattern in that with the latter, half of the thickness of the enclosing line segments falls outside of the boundaries.
| > | with(ImageTools): |
| > | with(ImageTools:-Draw): |
Solid gray rectangle.
| > | img := Create(240,320,channels=3,background=white): |
| > | SolidRectangle(img,32,32,288,208,color=0.5); |
| > | Embed(img); |

Supporting Functions for the Examples
Draw a red cross hair cantered at (xscale,yscale).
| > | crossHair := proc( img :: Array, x :: numeric, y :: numeric, scale :: numeric )
uses ImageTools:-Draw; Line(img,(x-1.5)*scale,y*scale,(x+1.5)*scale,y*scale, color="red",thickness=1.5); Line(img,x*scale,(y-1.5)*scale,x*scale,(y+1.5)*scale, color="red",thickness=1.5) end: |
Draw a background grid with specified interval.
| > | gridFill := proc( img :: Array, interval :: numeric )
local x, y, w, h; uses ImageTools:-Draw; w, h := Width(img), Height(img); for x from interval by interval while x < w do Line(img,x,0,x,h,color=[0,1,1,0.25]) od; for y from interval by interval while y < h do Line(img,0,y,w,y,color=[0,1,1,0.25]) od end: |
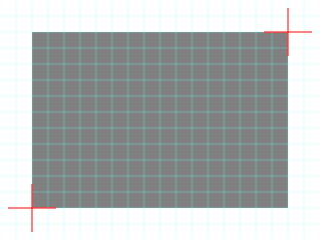
The images below were generated at 20 pixels width and 15 pixels height, magnified by a factor of 16, and then augmented with red crosshairs to show the mathematical corners of the rectangles.
Zoomed solid gray rectangle with integer bounds.
| > | img := Create(15,20,channels=3,background=white): |
| > | SolidRectangle(img,2,2,18,13,color=0.5); |
| > | img := Scale(img,16,method=nearest): |
| > | gridFill(img,16); |
| > | crossHair(img,2,2,16); |
| > | crossHair(img,18,13,16); |
| > | Embed(img); |
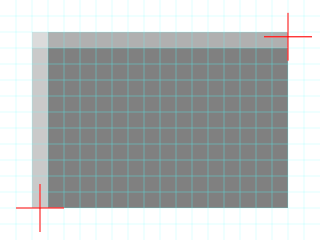
Zoomed solid gray rectangle with some non-integer bounds.
| > | img := Create(15,20,channels=3,background=white): |
| > | SolidRectangle(img,2.5,2,18,12.7,color=0.5); |
| > | img := Scale(img,16,method=nearest): |
| > | gridFill(img,16); |
| > | crossHair(img,2.5,2,16); |
| > | crossHair(img,18,12.7,16); |
| > | Embed(img); |
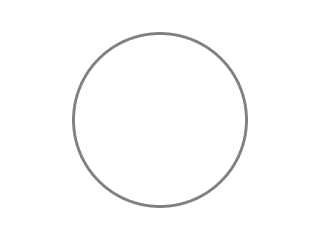
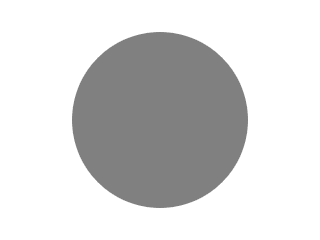
The Circle and SolidCircle Primitives draw either an outlined or solid circle around a specified center point and with a specified diameter. Like the SolidRectangle primitive, the circle is perceptually entirely within the bounds specified by the center point and diameter.
| > | with(ImageTools): |
| > | with(ImageTools:-Draw): |
Circle with thick edge.
| > | img := Create(240,320,channels=3,background=white): |
| > | Circle(img,160,120,240-64,color=0.5,thickness=3); |
| > | Embed(img); |
| > | Write("circ1.png",img); |
Solid gray circle.
| > | img := Create(240,320,channels=3,background=white): |
| > | SolidCircle(img,160,120,240-64,color=0.5); |
| > | Embed(img); |
Supporting Functions for the Examples
Draw a red cross hair centered at (xscale,yscale).
| > | crossHair := proc( img :: Array, x :: numeric, y :: numeric, scale :: numeric )
uses ImageTools:-Draw; Line(img,(x-1.5)*scale,y*scale,(x+1.5)*scale,y*scale, color="red",thickness=1.5); Line(img,x*scale,(y-1.5)*scale,x*scale,(y+1.5)*scale, color="red",thickness=1.5) end: |
Draw a background grid with specified interval.
| > | gridFill := proc( img :: Array, interval :: numeric )
local x, y, w, h; uses ImageTools:-Draw; w, h := Width(img), Height(img); for x from interval by interval while x < w do Line(img,x,0,x,h,color=[0,1,1,0.25]) od; for y from interval by interval while y < h do Line(img,0,y,w,y,color=[0,1,1,0.25]) od end: |
Unzoomed image to hold all four of the following circles.
| > | img4 := Create(62,80,channels=3,background=white): |
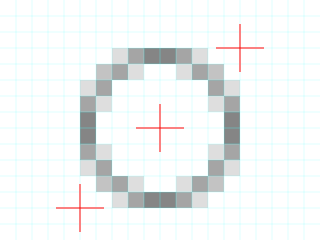
The images below will be generated at 20 pixels width and 15 pixels height, magnified by a factor of 16, and then augmented with red crosshairs to show the mathematical corners of the circles.
Zoomed circle with thin edge.
| > | img := Create(15,20,channels=3,background=white): |
| > | Circle(img,10,7,10,color=0.5,thickness=1); |
| > | img4[9..23,11..30] := img: # copy into collage |
| > | img := Scale(img,16,method=nearest): |
| > | gridFill(img,16); |
| > | crossHair(img,10,7,16); |
| > | crossHair(img,5,2,16); |
| > | crossHair(img,15,12,16); |
| > | Embed(img); |
Zoomed circle with thick edge.
| > | img := Create(15,20,channels=3,background=white): |
| > | Circle(img,10,7,10,color=0.5,thickness=2.5); |
| > | img4[9..23,51..70] := img: # copy into collage |
| > | img := Scale(img,16,method=nearest): |
| > | gridFill(img,16); |
| > | crossHair(img,10,7,16); |
| > | crossHair(img,5,2,16); |
| > | crossHair(img,15,12,16); |
| > | Embed(img); |
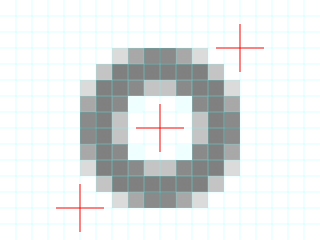
Both of these two circles above have the same center coordinates and same diameter. Since the center coordinates are integers, and the diameter is an integer multiple of two, the left, right, top, and bottom edges coincide exactly with pixel boundaries. In the second circle, notice that the edge pixels are identical to those of the first circle; the additional edge thickness has not made the circle any larger.
Zoomed solid circle with integer center and bounds.
| > | img := Create(15,20,channels=3,background=white): |
| > | SolidCircle(img,10,7,10,color=0.5); |
| > | img4[40..54,11..30] := img: # copy into collage |
| > | img := Scale(img,16,method=nearest): |
| > | gridFill(img,16); |
| > | crossHair(img,10,7,16); |
| > | crossHair(img,5,2,16); |
| > | crossHair(img,15,12,16); |
| > | Embed(img); |
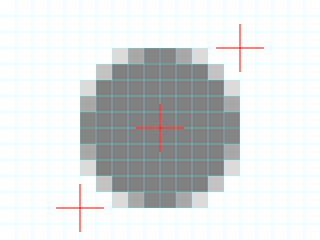
Zoomed solid circle with non-integer center and bounds.
| > | img := Create(15,20,channels=3,background=white): |
| > | SolidCircle(img,10.3,7.4,11,color=0.5); |
| > | img4[40..54,51..70] := img: # copy into collage |
| > | img := Scale(img,16,method=nearest): |
| > | gridFill(img,16); |
| > | crossHair(img,10.3,7.4,16); |
| > | crossHair(img,4.8,1.9,16); |
| > | crossHair(img,15.8,12.9,16); |
| > | Embed(img); |
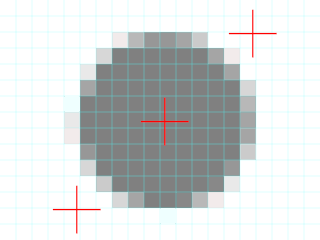
The first solid circle above has the same coordinates and diameter as the first open circle, and hence has the same alignment and identical edge pixels. The second solid circle above has non-integer center coordinates and a non-even diameter, resulting in some edges that don't fall on pixel boundaries.
Write collage containing the previous four circles at original size. The following image shows each of the four circles above, rendered at their original size.
| > | Embed(img4); |

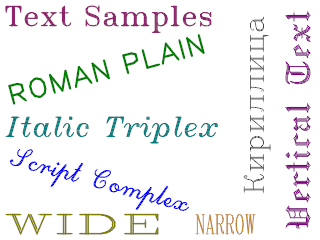
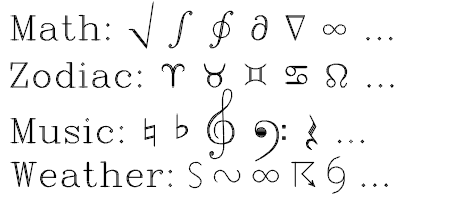
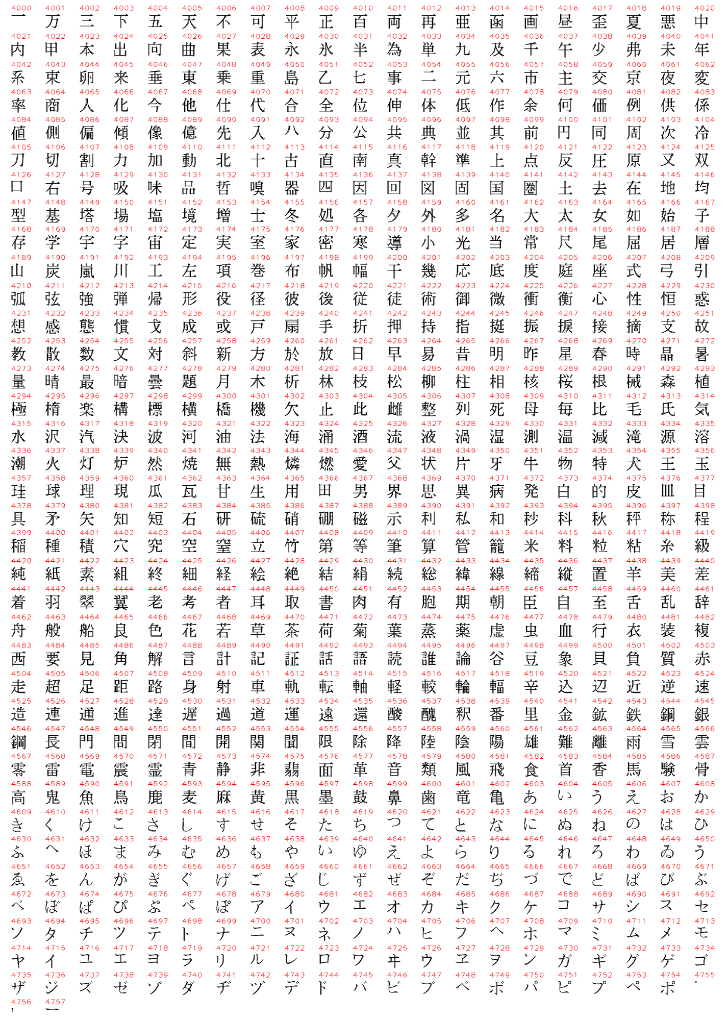
Images can be annotated with text using the Text primitive. The text produced is based on the Hershey vector fonts, first published by Dr. Allen V. Hershey in 1967. These fonts are platform and resolution independent, and are rendered by ImageTools:-Draw using anti-aliasing. They can be rotated, and scaled independently in width and height. In addition to the usual ASCII characters, the Hershey fonts contain Greek and Cyrillic glyphs, a subset of Japanese characters, and a large collection of symbols.
| > | with(ImageTools): |
| > | with(ImageTools:-Draw): |
Collage of text samples.
| > | img := Create(240,320,channels=3,background=white): |
| > | Text(img,5,235,"Text Samples",position="SE",font=16,font_size=20,weight=1.5,color="maroon"): |
| > | Text(img,10,145,"Roman Plain",position="E",font=14,font_size=20,weight=1.2,color=[0,0.5,0],rotation=15,degrees): |
| > | Text(img,5,110,"Italic Triplex",position="E",font=10,font_size=20,weight=1.5,color=[0,0.5,0.5]): |
| > | Text(img,10,80,"Script Complex",position="E",font=17,font_size=20,weight=1.5,color="blue",rotation=-Pi/12): |
| > | Text(img,310,120,"Vertical Text",position="N",font=1,font_size=25,color=[0.5,0,0.5],rotation=90,degrees): |
| > | Text(img,270,135,"Kirillica",position="N",font=0,font_size=20,color=[0.25,0.25,0.25],rotation=Pi/2): |
| > | Text(img,5,5,"WIDE",position="NE",font=11,font_size=[45,20],weight=1.2,color=[0.5,0.5,0]): |
| > | Text(img,195,5,"NARROW",position="NE",font=11,font_size=[10,20],weight=1.5,color=[0.75,0.5,0]): |
| > | Embed(img); |
Sample of each font 10.
| > | img := Create(35,320,channels=3,background=white): |
| > | Text(img,5,17,"ABCD abcd 0123 $&?*",position="E",
font=10,font_size=17,weight=1.2,color=0): |
| > | Embed(img); |
![]()
The font_size argument.
| > | img := Create(120,400,channels=3,background=white): |
| > | Text(img,10,100,"font_size=20",position="E",font=11,
font_size=20,weight=1.5,color=0): |
| > | Text(img,10,60,"font_size=[14,20]",position="E",font=11,
font_size=[14,20],weight=1.5,color=0): |
| > | Text(img,10,20,"font_size=[28,20]",position="E",font=11,
font_size=[28,20],weight=1.5,color=0): |
| > | Embed(img); |

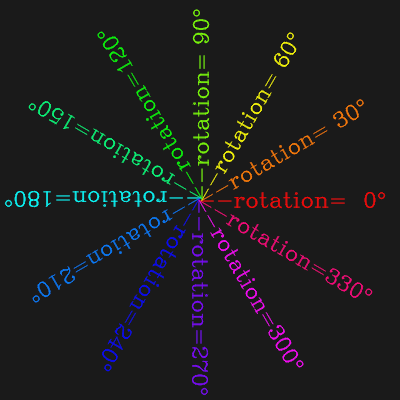
The rotation argument.
| > | img := Create(400,400,channels=3,background=[0.1,0.1,0.1]): |
| > | for r from 0 to 359 by 30 do
Text(img,200,200,sprintf("--rotation=%3d\e718",r),position="E", font=11,font_size=15,weight=1.10,rotation=r,degrees=true, color=("HSV",[r/360,1,1])) od: |
| > | Embed(img); |
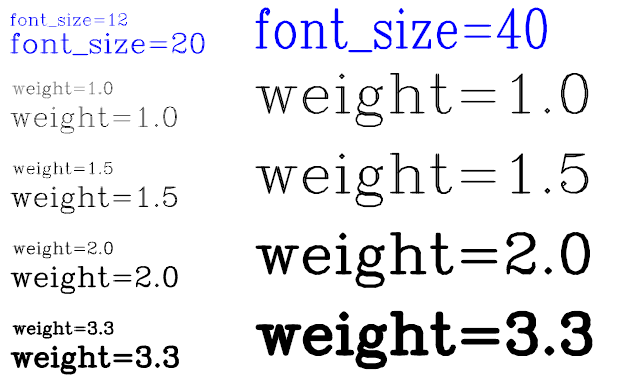
Effect of the weight argument with different font sizes.
| > | img := Create(380,620,channels=3,background=white): |
| > | Text(img,10,360,"font_size=12",position="E",font=11,
font_size=12,weight=1.5,color="blue"): |
| > | Text(img,10,336,"font_size=20",position="E",font=11,
font_size=20,weight=1.5,color="blue"): |
| > | Text(img,12,290,"weight=1.0",position="E",font=11,
font_size=12,weight=1.0,color=0): |
| > | Text(img,12,210,"weight=1.5",position="E",font=11,
font_size=12,weight=1.5,color=0): |
| > | Text(img,12,130,"weight=2.0",position="E",font=11,
font_size=12,weight=2.0,color=0): |
| > | Text(img,12,50,"weight=3.3",position="E",font=11,
font_size=12,weight=3.3,color=0): |
| > | Text(img,10,260,"weight=1.0",position="E",font=11,
font_size=20,weight=1.0,color=0): |
| > | Text(img,10,180,"weight=1.5",position="E",font=11,
font_size=20,weight=1.5,color=0): |
| > | Text(img,10,100,"weight=2.0",position="E",font=11,
font_size=20,weight=2.0,color=0): |
| > | Text(img,10,20,"weight=3.3",position="E",font=11,
font_size=20,weight=3.3,color=0): |
| > | Text(img,255,350,"font_size=40",position="E",font=11,
font_size=[30,40],weight=1.5,color="blue"): |
| > | Text(img,255,280,"weight=1.0",position="E",font=11,
font_size=40,weight=1.0,color=0): |
| > | Text(img,255,200,"weight=1.5",position="E",font=11,
font_size=40,weight=1.10,color=0): |
| > | Text(img,255,120,"weight=2.0",position="E",font=11,
font_size=40,weight=2.0,color=0): |
| > | Text(img,255,40,"weight=3.3",position="E",font=11,
font_size=40,weight=3.3,color=0): |
| > | Embed(img); |
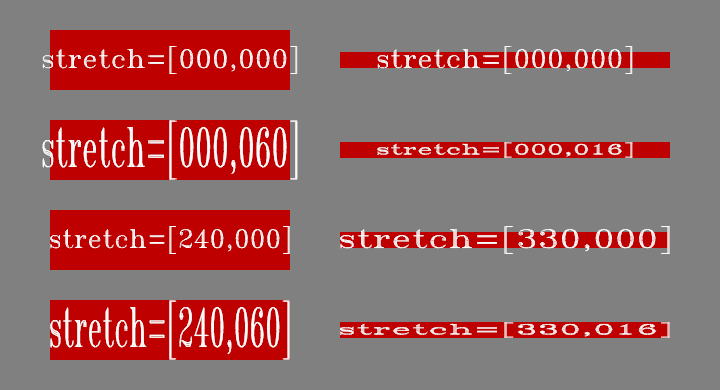
Using the stretch argument.
| > | wL, hL, xOff, yOff := 240, 60, 50, 30: |
| > | fntSz := wL / 13: |
| > | wR, hR := 330, floor(fntSz*0.9): |
| > | img := Create(4*hL+5*yOff,wL+wR+3*xOff,channels=3,background=0.5): |
| > | for cw in [0,1] do
for ch in [0,1] do r := (1-cw) * 2 + (1-ch); # Left column of examples. x := xOff; y := r * (yOff + hL) + yOff; SolidRectangle(img,x,y,x+wL,y+hL,color=[0.75,0,0]); Text(img,x+wL/2,y+hL/2, sprintf("stretch=[%03d,%03d]",wL*cw,hL*ch), position="*",font=16,font_size=fntSz,color=1, stretch=[wL*cw,hL*ch]); # Right column of examples. x := xOff * 2 + wL; y := y + (hL - hR) / 2; SolidRectangle(img,x,y,x+wR,y+hR,color=[0.75,0,0]); Text(img,x+wR/2,y+hR/2, sprintf("stretch=[%03d,%03d]",wR*cw,hR*ch), position="*",font=16,font_size=fntSz,color=1, stretch=[wR*cw,hR*ch]) od od: |
| > | Embed(img); |
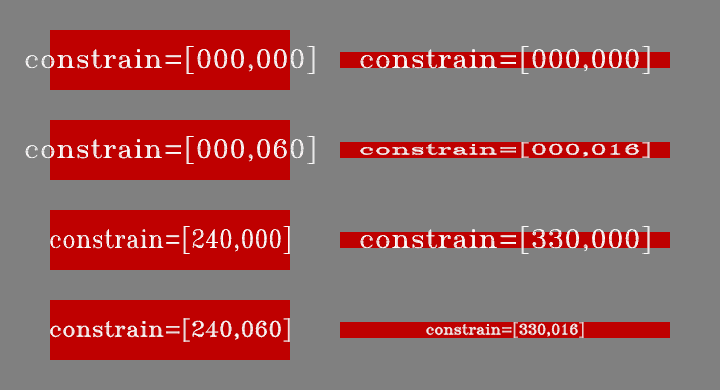
Using the constrain argument.
| > | wL, hL, xOff, yOff := 240, 60, 50, 30: |
| > | fntSz := wL / 13: |
| > | wR, hR := 330, floor(fntSz*0.9): |
| > | img := Create(4*hL+5*yOff,wL+wR+3*xOff,channels=3,background=0.5): |
| > | r := 3: |
| > | for cw in [0,1] do
for ch in [0,1] do r := (1-cw) * 2 + (1-ch); x := xOff; y := r * (yOff + hL) + yOff; SolidRectangle(img,x,y,x+wL,y+hL,color=[0.75,0,0]); Text(img,x+wL/2,y+hL/2, sprintf("constrain=[%03d,%03d]",wL*cw,hL*ch), position="*",font=16,font_size=fntSz,color=1, constrain=[wL*cw,hL*ch]); x := xOff*2 + wL; y := y + (hL - hR) / 2; SolidRectangle(img,x,y,x+wR,y+hR,color=[0.75,0,0]); Text(img,x+wR/2,y+hR/2, sprintf("constrain=[%03d,%03d]",wR*cw,hR*ch), position="*",font=16,font_size=fntSz,color=1, constrain=[wR*cw,hR*ch]) od od: |
| > | Embed(img); |
Manual kerning using b and t.
| > | img := Create(105,420,channels=3,background=white): |
| > | Text(img,10,75,"ACTIVATION Typewriter",
position="E",font=13,font_size=25,weight=1.2,color=0): |
| > | Text(img,10,25,
"A\b\bC\bT\tIV\b\b\b\bA\b\bT\tIO\bN T\b\b\b\by\b\bp\be\b\bw\b\br\t\titer", position="E",font=13,font_size=25,weight=1.2,color=0): |
| > | Embed(img); |

Changing font mid-text using f.
| > | img := Create(55,600,channels=3,background=white): |
| > | Text(img,10,25,"Embedded \f8italic\f11 and \f17script\f11 text",
position="E",font=11,font_size=25,weight=1.2,color=0): |
| > | Embed(img); |

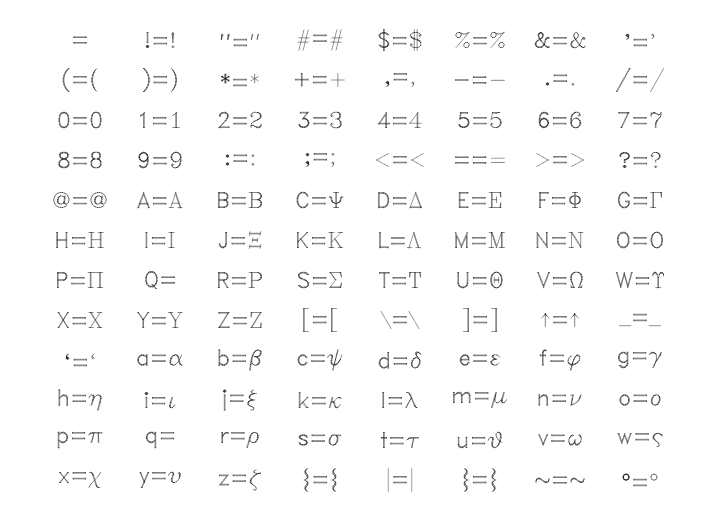
Generate the charts mapping Latin to Greek and Cyrillic characters.
| > | w, h := 720, round(w * 8/11): |
| > | rs, cs := round(h / 13), round(w / 9): |
| > | fntSz := h / 33.33: |
| > | for L in [[0,"cy-map"], [4,"gr-map"]] do
img := Create(h,w,3,background=white): for r from 0 to 11 do for c from 0 to 7 do ch := convert([r*8+c+32],bytes); Text(img,(c+1)*cs,h-(r+1)*rs, sprintf("%s=\f%02d%s",ch,L[1],ch), position="*",font=13,font_size=fntSz,color=0) od od; if L[2] = "cy-map" then imgC := img; else imgG := img; end if; od: |
| > | Embed(imgC); |
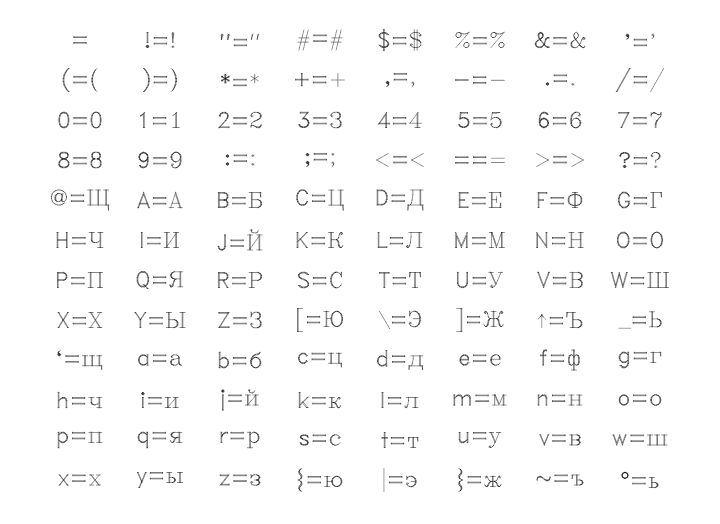
| > | Embed(imgG); |
A sample of some of the available non-ASCII glyphs.
| > | img := Create(200,450,channels=3,background=white): |
| > | Text(img,10,175,"Math: \e1411 \e2268 \e2269 \e2265 \e2266 \e2270 ...",
position="E",font=11,font_size=25,weight=1.2,color=0): |
| > | Text(img,10,125,"Zodiac: \e2301 \e2302 \e2303 \e2304 \e2305 ...",
position="E",font=11,font_size=25,weight=1.2,color=0): |
| > | Text(img,10,75,"Music: \e2324 \e2325 \e2330 \e2381 \e2378 ...",
position="E",font=11,font_size=25,weight=1.2,color=0): |
| > | Text(img,10,25,"Weather: \e764 \e765 \e766 \e767 \e768 ...",
position="E",font=11,font_size=25,weight=1.2,color=0): |
| > | Embed(img); |
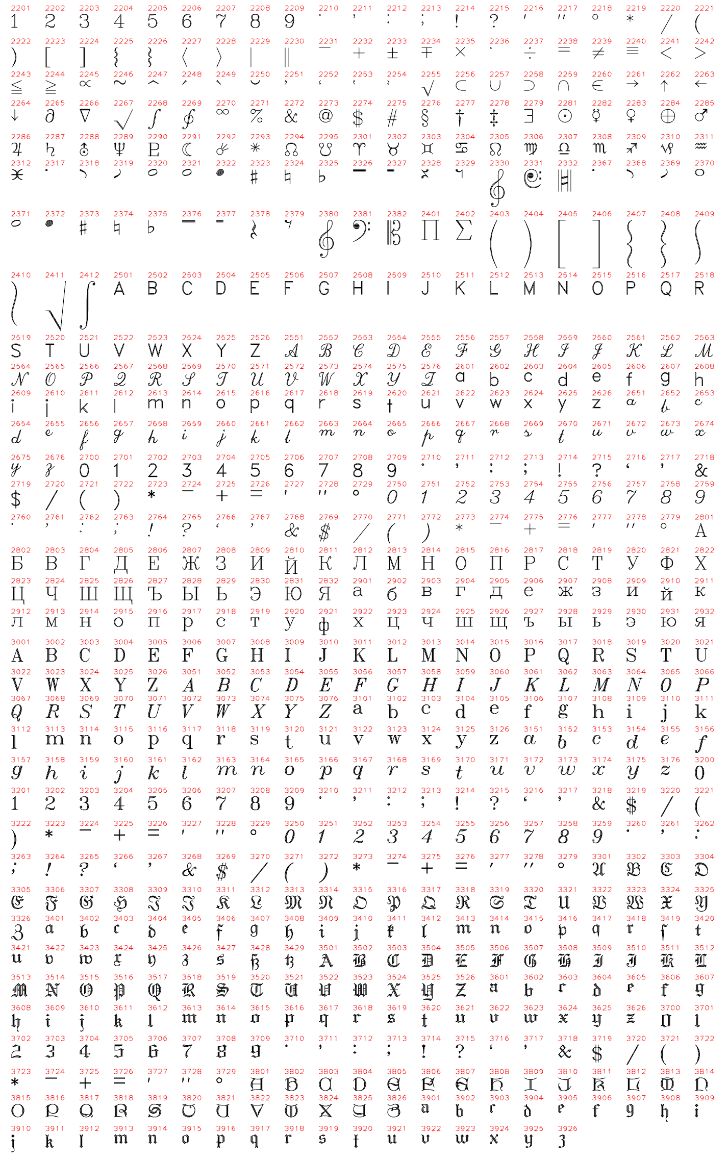
Generate the charts of (1) Japanese characters and (2) all other glyphs.
| > | glyphW := 67: |
| > | for chart in [[round(21.3*glyphW),"jp",4000,4757],
[round(21.3*glyphW),"sy1",1,2200], [round(21.3*glyphW),"sy2",2201,3926]] do w, file, lo, hi := op(chart); h := round(w * 1.7); # Enough for each chart; will be truncated below. x, y := glyphW/4, 10: img := Create(h,w,3,background=white): dymax := 0; for n from lo to hi do s := sprintf("\e%d",n); (dx,dy) := TextSize(img,s,font=14,font_size=12,weight=1.2); dx, dy := dx-1, dy-1; if (dx,dy) <> (0.,0.) then # Glyph number. Text(img,x+5,h-y,sprintf("%d",n),position="SE", font=14,font_size=10,color="red",weight=1.2); # Glyph. Text(img,x+5,h-y-17,s,position="SE", font=14,font_size=12,color=0,weight=1.2); # Find next column. Skip extra columns if glyph is too wide. while dx > -5 do x := x + glyphW; dx := dx - glyphW od; # Keep track of the tallest glyph in this row. if dy > dymax then dymax := dy fi; # Start a new row if we've reached the right edge. if x >= w - 3 * glyphW / 4 or n = hi then x := glyphW / 4; y := y + 25 + dymax; dymax := 0; if y >= h then break fi fi fi od; # Truncate image to just the part we've filled. img := img[1..round(y+10),..,..]; assign(cat('img_',chart[2]),img); od: |
| > | Embed(img_jp); |
| > | Embed(img_sy1); |
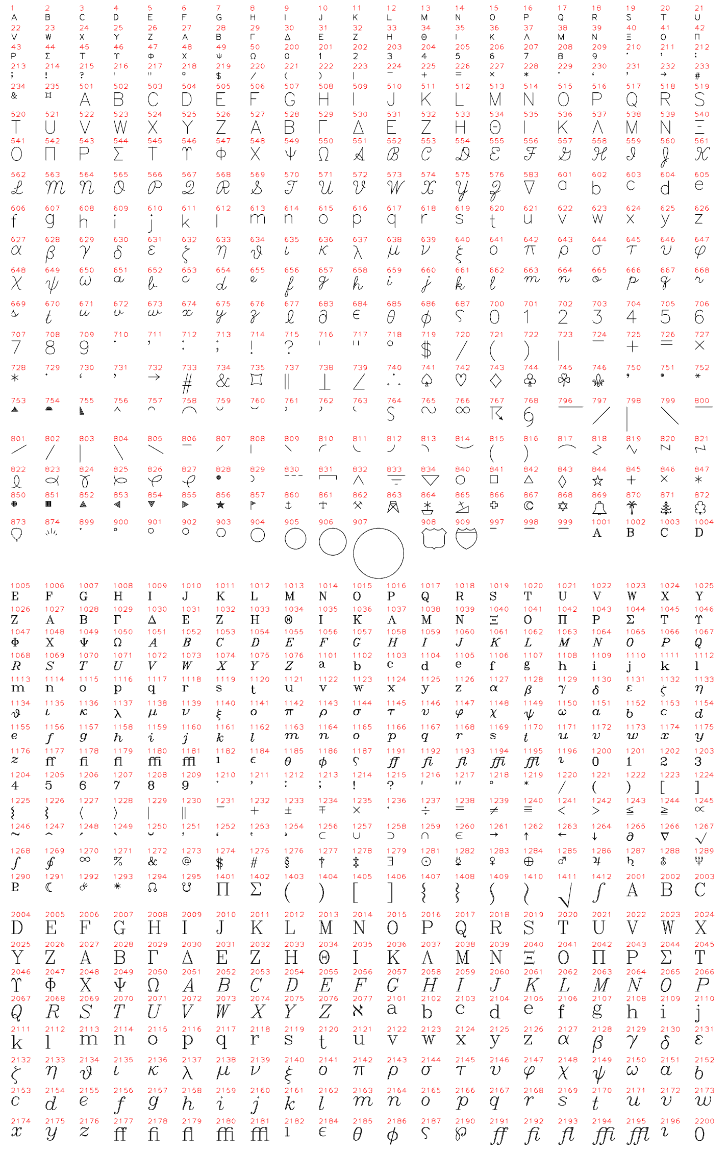
| > | Embed(img_sy2); |
ASCII to Cyrillic and Greek mapping.
| > | img := Create(105,640,channels=3,background=white): |
| > | Text(img,10,75,"Vostok, Pilot = \f0Vostok, Pilot",
position="E",font=11,font_size=25,weight=1.2,color=0): |
| > | Text(img,10,25,"Archimedes = \f4Arximhdhw",
position="E",font=11,font_size=25,weight=1.2,color=0): |
| > | Embed(img); |

ImageTools:-Draw provides the TextSizefunction to aid in the manipulation of text. TextSizereturns the width and height of a piece of text given a subset of the arguments accepted by the Text primitive
| > | with(ImageTools): |
| > | with(ImageTools:-Draw): |
Determining the extent of rendered text.
| > | w, h := 500, 120; |
| > | img := Create(h,w,channels=3,background=0.5): |
| > | msg := "Red Box Fits the Text"; |
| > | boxW, boxH := TextSize(img,msg,font=10,font_size=25,weight=1.5); |
| > | x1, y1 := (w - boxW) / 2, (h - boxH) / 2; |
| > | x2, y2 := (w + boxW) / 2, (h + boxH) / 2; |
| > | SolidRectangle(img,x1,y1,x2,y2,color=[0.75,0,0]); |
| > | Text(img,w/2,h/2,msg,position="*",font=10,font_size=25,weight=1.5,color=1); |
Draw a border 5 pixels outside the box.
| > | x1, y1, x2, y2 := x1-5, y1-5, x2+5, y2+5; |
| > | Poly(img,[[x1,y1],[x1,y2],[x2,y2],[x2,y1],[x1,y1]],color="yellow"); |
| > | Embed(img); |
