Visualization improvements in Maple 17 include:
- The enhanced Plot Builder, which lets you easily embed interactive plots whose parameters are controlled by sliders directly into your document
- Automatic 3-D axes are shown by default for all 3-D plots
- Improved plotting of inequalities, which supports the plotting of nonlinear inequalities and makes it easier to specify the style of the plotted region and to combine plots of multiple regions
- Easy visualization of branch cuts in 2-D and 3-D plots
- New group theory visualizations for drawing Cayley tables and subgroup lattices
Interactive Plots with the Plot Builder
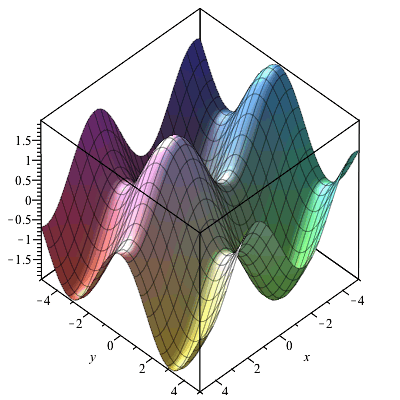
The Plot Builder Assistant has been enhanced in Maple 17 so that you can easily create interactive plots, whose parameters are controlled by sliders, directly in your document. By selecting the plot type "Interactive Plot with Parameters" in the Plot Builder, Maple will automatically place the resulting interactive plot in your document. For example, here is the plot of  . .
Automatic Axes on 3-D Plots
By popular demand, 3-D plots in the Standard Worksheet will now appear with a default axis setting of "boxed".
Example |
| > |
 |
|

|
Plotting Inequalities
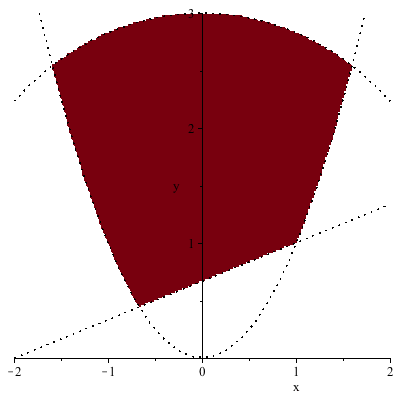
As of Maple 17 the inequality plotting command in the plots package is greatly improved. Most notably, it now supports the plotting of non-linear inequalities, but it also has improved the interface for specifying the style of the plotted region and for combining plots of multiple regions.
Example |
|

|
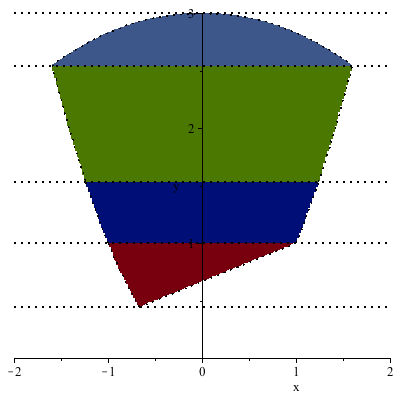
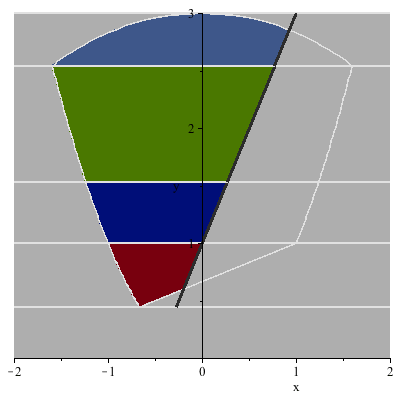
Multiple inequality plots can be combined with plots[display]:
Example |
|

|
Multiple inequality regions can also be plotted using one command:
Example |
|

|
Branch Cuts of Mathematical Expressions
Exploring branch cuts in mathematical expressions is easier using new plot options in the FunctionAdvisor command.
Example |
| > |
 |
|
Group Theory Visualizations
The Group Theory package features new visualizations for drawing Cayley tables and subgroup lattices of finite groups.
Example |
| > |
 |
| > |
 |
|
Example |

|

|
|
