|
Maple has a large collection of Clickable Math tools that guide you through a wide range of common tasks, from plotting a function to computing a volume integral, all without the need to know command names, learn syntax, or remember option names.
- Interactive Assistants step you through many common tasks, such as graphing a function or fitting data
- Over 50 Interactive Tutors allow you to gain an in-depth understanding of concepts from many areas in mathematics
- Over 300 Task Templates provide a starting point for performing particular computations
Maple15 adds 49 innovative demonstrations to its continuously expanding toolbox.
The demonstrations use interactive features and visualization to explore mathematical concepts. You can manipulate the inputs and instantly see the effects. The demonstrations can be incorporated into any learning environment, such as classroom demonstrations or independent studying.
Each demonstration is a multi-dimensional tool. They can be used to visualize and experiment with mathematical concepts. They also serve as examples for creating your own applications using interactive components. All Maple code used in the demonstrations can be easily viewed, modified, and copied, so it can be used as a starting point for your own work.
The demonstrations feature two main topics: functions and graphing. Below are some examples of demonstrations included in Maple 15.

Demonstrations Examples (functions)

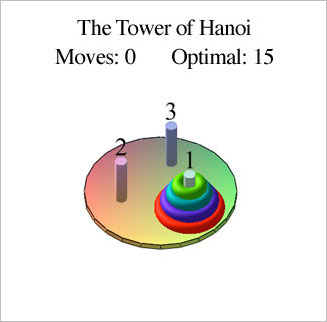
Maple has the capability to create an interactive game board. The above screenshot illustrates one of the more complicated demonstrations: The Tower of Hanoi (a mathematical puzzle). This example is used to illustrate the rapid growth of the exponential function. |

Many of the demonstrations incorporate animations to clarify concepts. This demonstration displays the product rule of logarithms graphically. First, you click the graph to specify two input values, and then you watch an animation showing the relationship between the logarithms of the inputs and the logarithm of their product. |

Demonstrations Examples (graphing)

In this demonstration, you click, or click-and-drag, to display a line segment on the graph. As you move the line segment, you can watch the midpoint change. |

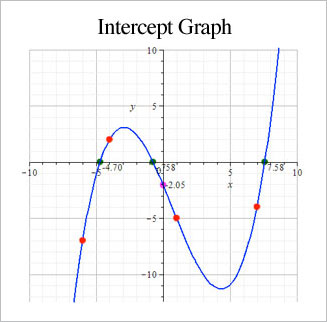
This demonstration illustrates the concept of x- and y-intercepts. You click the graph to select up to 5 points, through which a polynomial curve is interpolated. The x- and y-intercepts of the curve—if any—are highlighted.
|

|

