|
The Statistics package, like Maple itself, combines the advantages of numerical and symbolic approaches to problem solving. Using it, you can:
- Use any of the 38 predefined distributions, or define your own; put in symbolic parameters; and compute as many as 45 different
properties of the resulting random variable (more than any other system), such as the expected value, the kurtosis, or the cumulant generating function.
- Compute the same properities for arbitrary algebraic expressions involving random variables.
- Quickly generate enormous samples of each of these distributions, take advantage of many specialized visualization routines, and use algorithms
that are new in Maple 15 to compute cross-correlation and autocorrelation of data samples.
- Determine the maximum-likelihood estimate of distribution parameters from a sample that is either given concretely or that consists of symbolic values.
- Run data smoothing to extract identifiable patterns from noisy data.
- Use interactive assistants and templates to easily access the tremendous power of this package and get results quickly.
- Test hypotheses according to 11 different automated hypothesis testing routines.
- Perform process control calculations.

Compute properties of distributions

Compute properties of predefined distributions
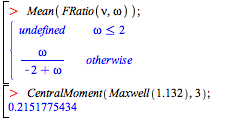
You can compute properties of predefined distributions, such as the mean of Fisher's F ratio distribution and the third central moment of a Maxwell distribution.
Compute properties of expressions involving a random variable
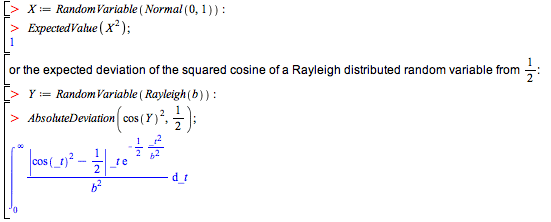
You can compute properties of expressions involving a random variable, such as the expected value of the square of a standard normal distributed random variable:
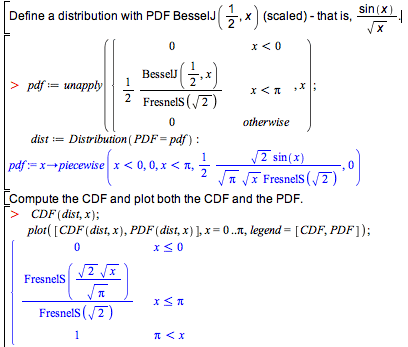
Compute properties involving custom-defined distributions


Quickly generate random samples
Generate a sample of a predefined distribution
Generate a sample of the standard normal distribution, consisting of ten million values.

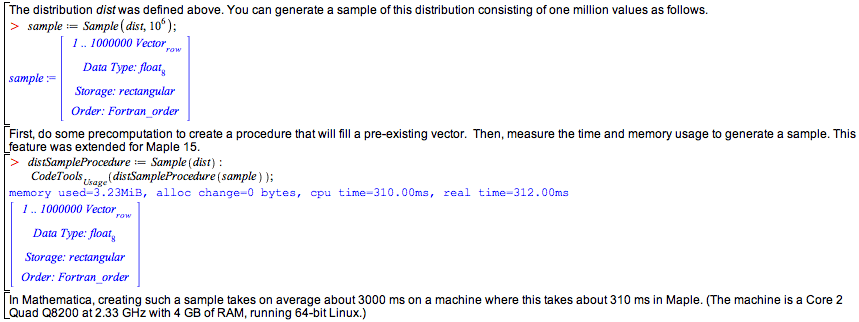
Maple is very fast at this. It can be made even faster if you do some precomputation and create a procedure that will fill a pre-existing vector.
This feature was extended for Maple 15. After first creating the procedure, then you can measure the time and system resources used to generate a sample.

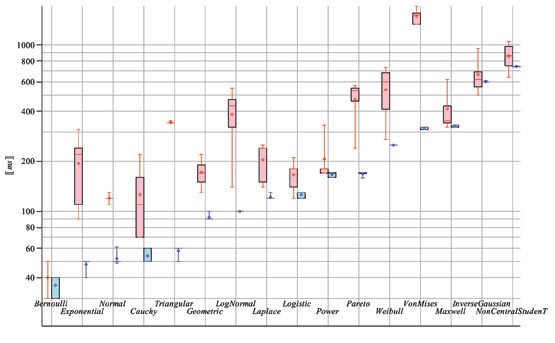
The following graph compares times to generate samples of size one million in Maple and Mathematica® in a few distributions. The times are in milliseconds of CPU time.
Maple times are given in blue, the Mathematica's times in red.

Generate a sample of a custom distribution
Run Monte Carlo simulations
Above, you computed the expected deviation of the squared cosine of a Rayleigh distributed random variable from 1/2. You can verify that computation by
taking samples for b = 1.512. You can do this "by hand" as follows:

Or you can use Maple's Bootstrap procedure, which will run the test a given number of times, then report its result and the standard error between runs:


Visualize data sets
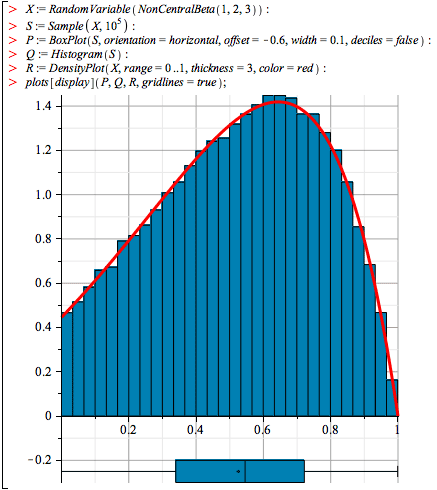
Generate a data set (a sample of the non-central beta distribution) and display a histogram along with the density plot of the distribution itself. You can also generate a box-and-whiskers plot of the same data sample and show them all in the same graph.
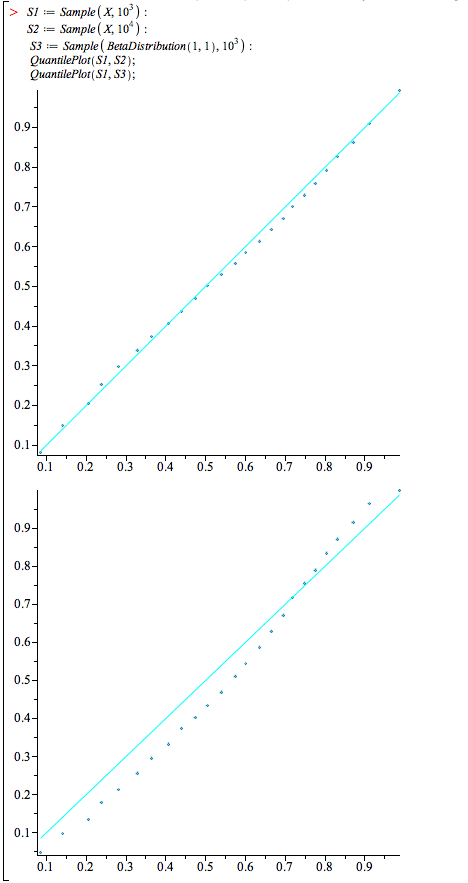
To determine whether two samples come from the same distribution, look at a quantile-quantile plot. Take two samples of the non-central beta distribution mentioned above, and one from a regular (central) beta distribution. The first two lead to a quantile-quantile plot that is very close to the diagonal, but the first and the third are not as close.

Compute cross-correlation and autocorrelation
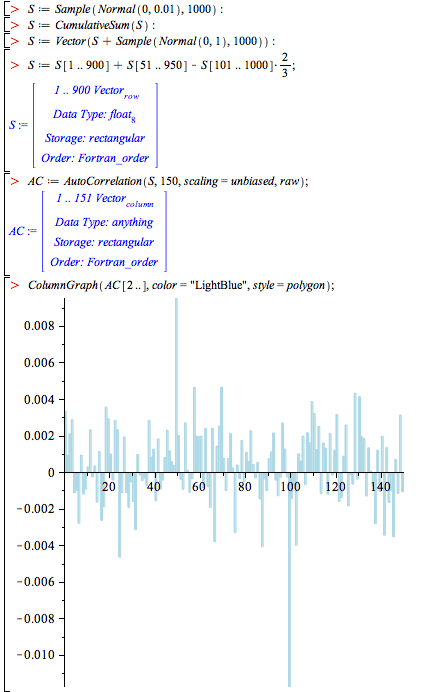
With the commands CrossCorrelation and AutoCorrelation (new in Maple 15), you can very efficiently compute the cross-correlation of two time series and the
autocorrelation of a time series. This can be used, for example, to determine periodicity.
In the following example, a time series that has a strong autocorrelation
at lags 50 (positive) and 100 (negative) is artificially constructed. Then those lags are found from the time series.

Estimate distribution parameters
Maximum likelihood estimation
Suppose you have a noisy measurement of something you would like to model as an exponentially
distributed random variable, with the rate parameter to be determined. Generate the noise by taking a slightly different distribution to generate the data: a gamma distribution with shape parameter 1.05 (shape parameter 1 would correspond to an exponential distribution).

Below, you can see that this is a good match.

Moment matching
Moment matching is an approach to parameter estimation where you equate the (symbolic) moments of the distribution with the computed moments of the sample.
Consider the case where you have a sample of a Weibull distribution with unknown parameters.
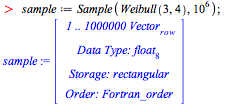
Compute the first four symbolic moments of the distribution and the numeric moments of the data sample.

Since there are only two parameters, you could just equate the first two moments of distribution and data to obtain two equations. However, then you have no idea
of whether this is a reasonable fit—two values will come out for any pair of data moments. By taking the first four, you can check that this is indeed a
Weibull-distributed sample. Minimize the relative distance between the two vectors of moments.


Data smoothing and manipulation
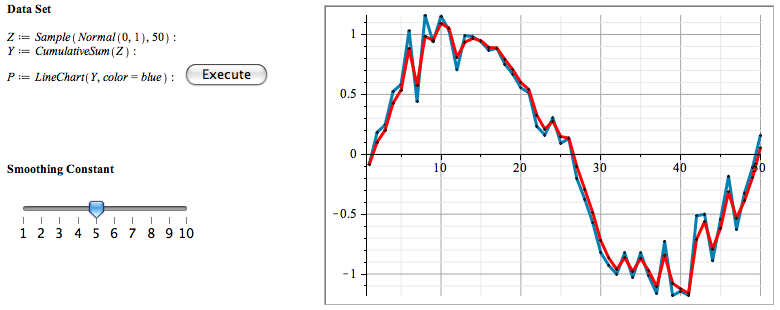
The Statistics package provides several functions for data manipulation and data smoothing. In the following example, a random sample Z
is created, and Y is defined to be the vector of cumulative sums of Z. This is an input to the exponential
smoothing command, the smoothing constant of which is determined by the slider; lower values give smoother results.

Hypothesis testing
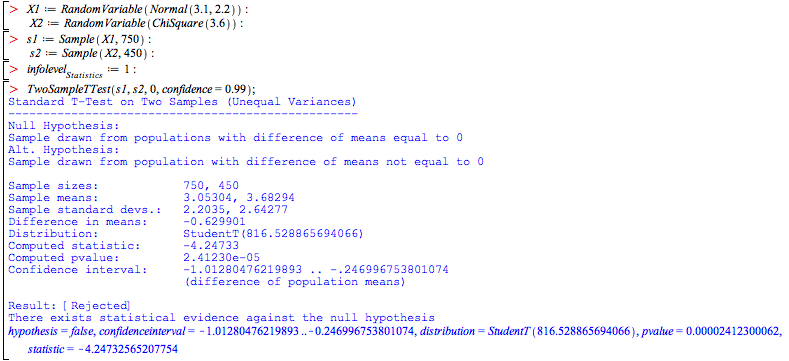
Maple gives you the tools to run 11 different automated tests, each using one simple command. For example, to test whether the hypothesis that two samples
that are approximately normally distributed, come from distributions with the same mean, is statistically likely, you can use the TwoSampleTTest command.
To obtain a full report, set the variable infolevelStatistics.
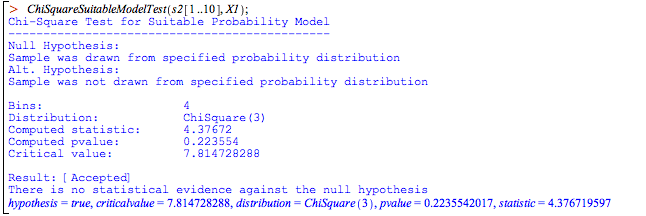
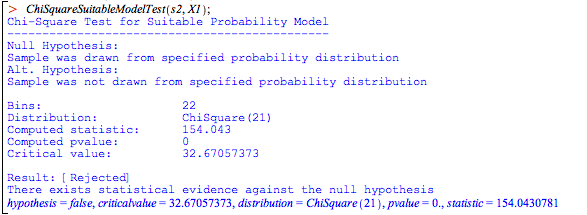
Here is another example. In order to test if a given sample is likely to have come from a given distribution, you can use the ChiSquareSuitableModelTest.
If you take just the first ten points of s2, it is not unlikely that it comes from the distribution of X1:
However, the sample with all 750 points
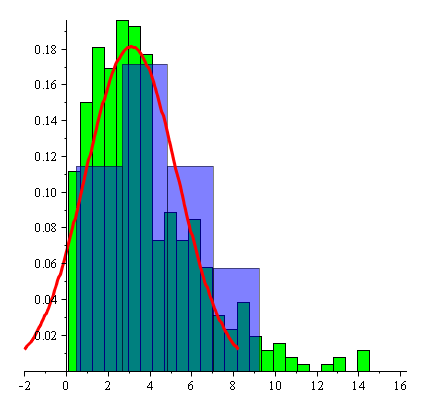
is very unlikely to come from X1.
This can also be seen from the histograms.


Process Control
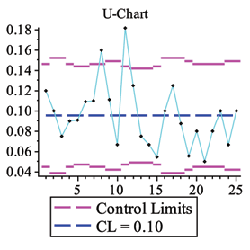
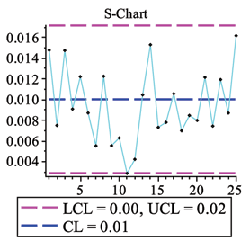
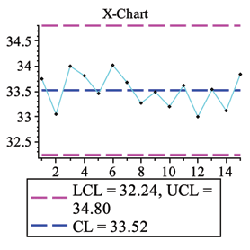
The ProcessControl package provides a number of statistical control charts as well as tools for computing control limits for these charts.

|
