New Features in Maple 2017 - Technical Computing Software for Engineers, Mathematicians, Scientists, Teachers and Students - Maplesoft

Maple

Pricing & Purchase
Upgrade to Maple 2018
What's New  |  Features  |  Online Demos  |  Compare  |  Training  |  Community  |  Free Trial  |  Buy Maple
What's New in Maple 2017

Maple 2017 has something for everyone. Here are just some of the new things you can do with Maple 2017:

Extend Maple's power with user-created packages
The MapleCloud now gives you instant, seamless access to a rich collection of user packages that extends Maple's abilities, and even notifies you when updates are available.

Construct even complicated plots easily
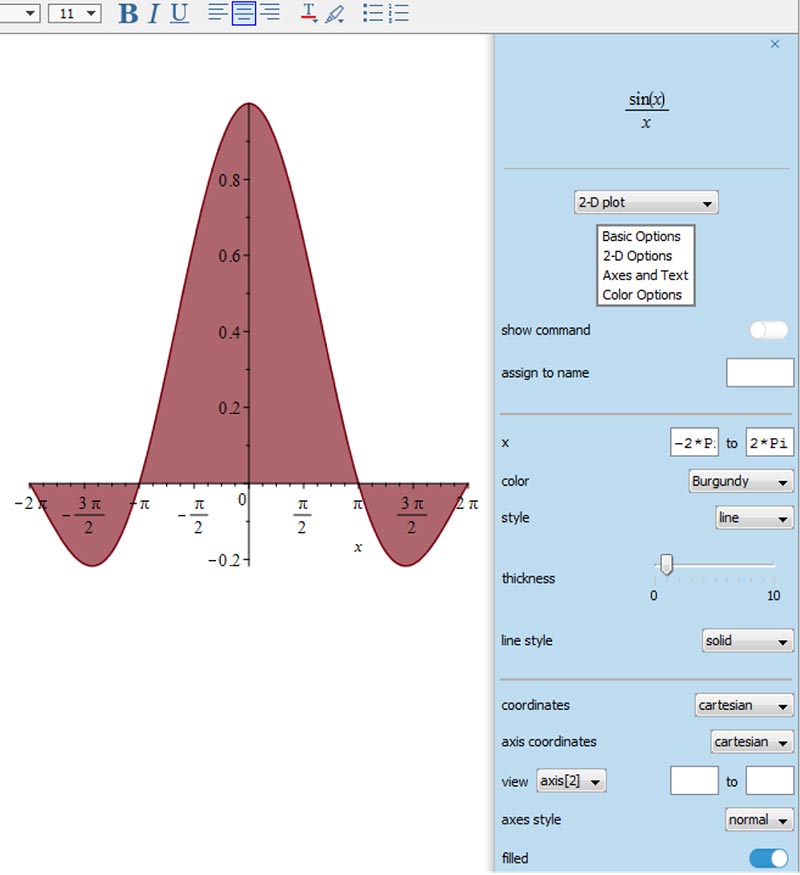
The Plot Builder in Maple 2017 has a new design that makes it even easier to create and customize a wide variety of plots, simply and without knowing a single plot command.

Solve more problems
With Maple 2017, you can find exact solutions to more PDEs with boundary conditions, find new limits, solve more integrals, perform new graph theory computations, calculate more group properties, work with new hypergeometric functions, and much more.

Protect your work
Now you can password protect worksheets while still allowing access to the procedures they contain, so you can share your work without sharing your IP.

Expand your worldview
New map visualization tools and a geographical database let you explore and understand world data in a highly visual way.

State your assumptions
You can give Maple even more information about your problem, and Maple will take these assumptions into account in even more computations, eliminating solutions you don't need and simplifying results appropriately.

Add a new layer of information to your plots
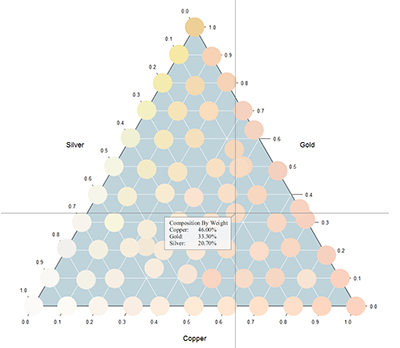
In Maple 2017, you can add dynamic plot annotations that will appear when you hover over specific points or curves, so you can convey even more information in your graphs.

Get a head start on engineering problem solving
The Maple Portal for Engineers, which provides a starting point for common engineering tasks, now covers many more topics, includes more examples, and provides sample applications to help you become productive quickly.

Develop your own algorithms and solutions
From performance improvements in core functions, to a more flexible debugger, to new tools that simplify package creation and distribution, Maple 2017 gives you everything you need to develop even complex algorithms and solutions on your own.

Get insight into your data
Enhanced support for statistics and data analysis includes new and improved visualizations, new data analysis tools, and expanded support for data frames throughout Maple, so you can work with and learn from your data.

Explore the new features


MapleCloud Package Manger

The MapleCloud now gives you instant, seamless access to a rich collection of user packages that extends Maple's abilities, and makes it easier for you to share your own work with others.

  • Easy access to a collection of user-created Maple packages from inside Maple using a significantly improved MapleCloud interface
  • One click installation of packages for immediate use
  • Growing list of available packages includes encryption, optimization, orthogonal series expansions, lattices, and more
  • Automatic notification of updates to packages you have installed
  • New tools for programmatically authoring and editing Maple packages that make it easier to turn your own work into a shareable Maple package
  • Easy uploading and sharing of your own packages through the new Packages group in the MapleCloud

Learn more...
Watch the video
 Interactive Plot Builder

The interactive plot builder, which provides an easy-to-use interface for creating and customizing plots without the use of commands, has been substantially updated for Maple 2017, making it more convenient and easier to use.

  • The Plot Builder supports the creation and customization of a wide variety of 2-D and 3-D plots through a point-and-click interface.
  • The Plot Builder interface panel emerges from the right-hand side of your workspace when needed, and disappears again when you are done.
  • You can switch seamlessly between the plot builder and the rest of your document.
  • The plot appears directly in your document and is updated immediately every time you make a change to the plot options, with no preview window required.
  • The options adjust dynamically in the panel, so that only relevant options are displayed, making it easy to find the selections you need.
  • Supported plot types include 2-D, 3-D, contour, implicit, density, conformal, complex, and animated curve plots.
  • Plot options and customizations include color, line style, gridlines, titles, legends, transparency, lighting, scaling, axis style, and much more.
  • The Maple command corresponding to your chosen options is available, so you can recreate your plot programmatically if desired, using exactly the same options you selected using the Plot Builder.
  • The Plot Builder is accessible through the context-sensitive menu, the Assistants menu, and by command.

Learn more...
Watch the video
Visualization
  • You can add dynamic plot annotations that will appear when you hover over specific points or curves, so you convey even more information in your graphs.
  • Contour plots now have labels on the contours that appear when the pointer is placed over a contour line.
  • The Thermophysical Data package now supports temperature-entropy charts for any pure fluid.
  • Choropleths, which apply coloring to a map to represent the magnitude of a variable, can be generated using the new geographic data tools.
  • The Signal Processing package includes new tools for generating a power spectrum plot.
  • New statistical visualization tools are available for Venn diagrams, violin plots, and Weibull plots.
  • Additional tools and options provide new options for generating and working with color data structures.
  • You can now easily view the colors in a palette by displaying the names and associated colors in a table.

Learn more...
Watch the video
Password Protection

You can password protect individual worksheets stored inside a Maple workbook, so they can only be viewed by those who have the password. These worksheets can still be executed, so you can pass parameters into the protected content, run its code, and get results out.


Learn more...
World Maps and Geographic Data

New map visualization tools and a geographical database let you explore and understand world data in a highly visual way.

  • New tools enable you to create visualizations of world maps and display geographic data, such as world maps under different projections or the shortest paths between cities using great circles.
  • Choropleth maps use gradient colors to convey the relative value for a given measurement, such as country literacy rates or population.
  • A built-in geographic information database contains data for over one million geographic locations around the world, including name, latitude, longitude, region, country, population, and time zone.
  • Data set handling tools allow you to ask for information such as 'which provinces in Canada have populations of over 4 million?' or 'find all places in the United States named Springfield'.

Learn more...
Watch the video
  • Solves more definite and indefinite integrals
  • Handles symbolic powers of hypergeometric functions
  • Improves simplification of integrals
  • Takes into account user-provided equality assumptions on variables in the integrand
  • Provides improved error handling
  • Improves integral transform computations

Learn more...
  • More flexible and powerful search for identifying small groups with specific properties
  • New algorithm for computing the ordinary character table of a finite group
  • Ability to determine the number of groups of a given order for much larger orders
  • Context-sensitive menus available for performing more operations without commands

Learn more...
Graph Theory
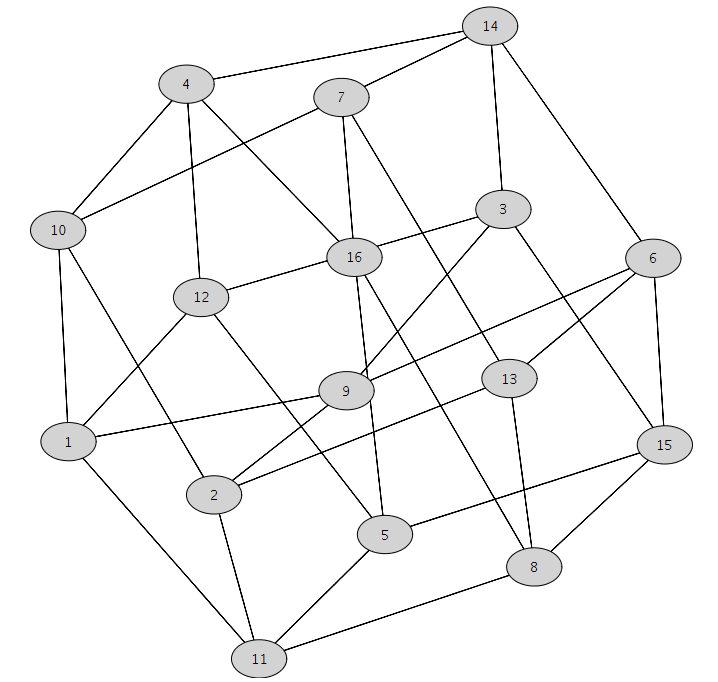
  • You can now control many aspects of how a graph is drawn, including colors, line weights, and font choices, and graphs are now drawn in grayscale by default.
  • A new command computes and returns the group of automorphisms of a given graph, represented as a permutation group.
  • You can visualize the action of an automorphism of a graph as an animation.
  • A command allows you to construct a canonical form of your graph by reordering the vertices.
  • You can now compute the eccentricity of a graph at a specified vertex or compute the list of eccentricities at each vertex.
  • The minimum eccentricity over the entire graph, known as the graph radius, can now be computed directly.
  • The Special Graphs subpackage now includes built-in commands to generate Book, Chvátal, Folkman, Franklin, Frucht, and Hoffman graphs.
  • File format support has been expanded to include import, export, and conversion support for the Digraph6 format, a concise text-based format for serializing a directed graph

Learn more...
Advanced Math
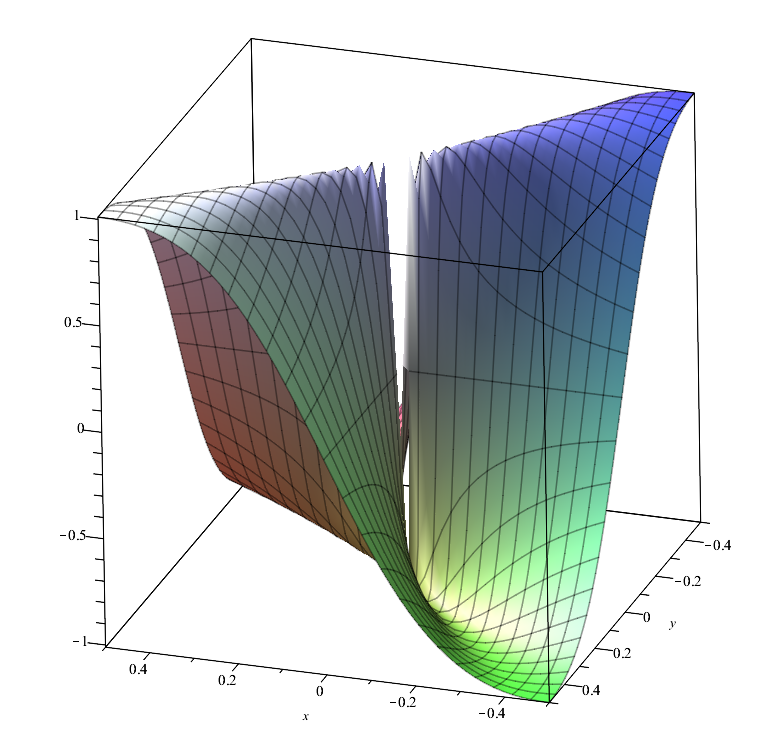
  • Expanded capabilities for finding many more limits of quotients of analytic functions in two variables
  • Improved symbolic summation of expressions involving binomials
  • Improvements to rationalizing and normalizing radical expressions
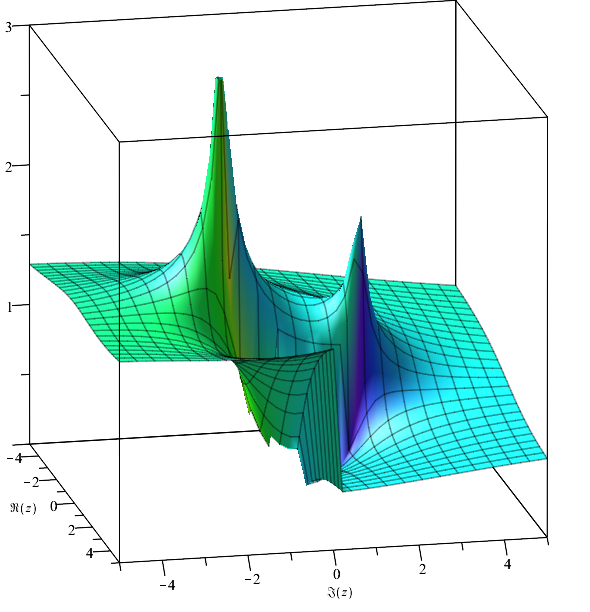
  • Asymptotic expansions and limits of asymptotic cases of the incomplete gamma function
  • More formal series expansions of inhomogeneous linear ODEs
  • Ability to compute the Boolean expression corresponding to the parity function on a set of variables
  • Expanded Number Theory package
  • Additional simplifications involving LambertW functions

Learn more...
Mathematical Functions
The Mathematical Functions package and the Function Advisor tool provide information on identities, alternative definitions, and mathematical properties in general for special functions, as well as supporting numeric and symbolic computations involving these functions. Maple 2017 adds support for the four Appell functions, which appear in applications in quantum mechanics, molecular physics, general relativity, and more. In addition, a new subpackage leverages Maple's symbolic capabilities to support the numerical evaluation of mathematical functions and expressions, numeric experimentation, and the rapid development of numerical algorithms for mathematical functions.


Learn more...
Partial Differential Equations
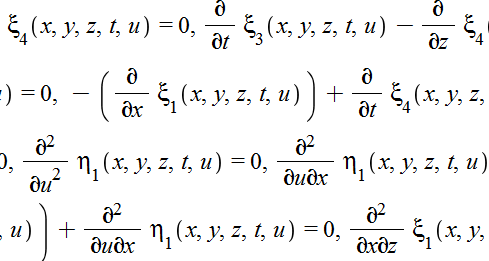
Several new algorithms for solving PDEs with boundary conditions allow Maple to find analytic solutions for many more of these types of problems. In addition, new options let you ask for a general solution to your PDE system and to learn whether a provided solution meets the definition of a general solution.


Learn more...

The assumption facility allows you to ask Maple to perform computations while assuming certain conditions hold, such as 'x is real and positive', or 'a < b'. It also enables you to ask questions about what properties are true, or could be true, given your assumptions. In Maple 2017, this facility was enhanced to expand its power and scope.

  • Better handling of multiple or complicated assumptions
  • Addition of functional properties, such as assuming | x | < 1
  • Improved treatment of conditions involving infinity, float, Gaussian integer, prime, real, imaginary, odd, even, Non, OrProp, Or, LinearProp, and inequalities
  • Improved handling of expressions involving SetOf, specified RootOfs, radicals, and the sign function
  • Improvements to solving linear inequalities involving assumptions
  • Improved simplification of piecewise expressions using assumptions
  • Improved handling of multiple periodic assumptions

Learn more...
Statistics and Data Analysis
  • New visualization tools for Venn diagrams, violin plots, and Weibull plots
  • Ability to specify colors or provide a color scheme for bar charts and column graphs
  • New option for detecting discontinuities in density plots
  • New command for removing one or more columns from a data frame
  • New command for changing the specified datatype of a data series and coercing any data in that data series into the given datatype, when possible
  • Wider support for data frames and data series in general Maple commands, such as curve fitting routines, sort, and Describe

Learn more...

Maple provides a state-of-the-art environment for algebraic computations in physics, with emphasis on ensuring that the computational experience is as natural as possible. In Maple 2017, significant work was done in the area of general relativity, including classifying spacetime metrics and providing tools for determining metric equivalencies. Improvements were also made to tensor representations, support for non-commutative operations, physics-based data types, and more.


Learn more...
  • Numerous improvements to the debugger, including counted breakpoints that only trigger on specified iterations through the code, numbered source code display, depth-limited tracing, and better stack tracking when inspecting variables
  • Ability to test expression equivalency independent of variables names
  • New MATLAB® connectivity command that modifies phase angles in radians in an array to ensure the difference between consecutive elements in the result is less than π
  • Programmatic construction of indexed expressions
  • Choice of behavior when computing maximums and minimums in the cases where these functions are called with no arguments or empty container arguments
  • Expansion of the sort command to handle data frames and data series
  • Use of three-valued logic in the andmap and ormap commands

Learn more...
Statistics and Data Analysis
  • Supports for MP4 files in the video component
  • Separate control over visibility and expansion of code edit regions
  • Ability to keep track of the selected items from Combo Box or List Box components by their index rather than their value

Learn more...

A new mode of working with units gives you the option of changing Maple's behavior in certain cases, to better suit the needs of your particular problem. Using the new mode, you can use unassigned variables to represent quantities that are not unitless. In addition, you can ask Maple to ignore unit annotations, such as the type of liquid being measured or the fact that the length is measuring a radius, when verifying dimensional correctness. It is possible to temporarily switch to this mode while otherwise using one of the other available modes for units. In addition, a new command allows you to test dimensional correctness, or, if some of the variables do not have units assigned to them, to verify that there exists a valid dimensional assignment that would make it correct.


Learn more...
  • New package for converting Maple expressions to input in the SMT-LIB language format, an interface language frequently used by programs designed to solve Satisfiability Modulo Theories (SMT) problems
  • An extension to the URL package that enables Maple to make use of Representational State Transfer (REST) web interfaces, which offer access and manipulation of online resources by use of a uniform set of stateless operations based on HTTP
  • New YAML package that allows import and export of files and strings in the YAML format, a lightweight file format for exchanging structured data
  • Code generation for Swift, a programming language developed by Apple® for creating apps on Apple devices

Learn more...

Performance enhancements include a large number of improvements to fundamental Maple routines used extensively by other Maple commands.

  • Solving polynomial systems is now faster due to a new compiled implementation of a Groebner basis algorithm.
  • A powerful new algorithm for simplifying large multivariate rational expressions allows Maple to normalize expressions it could not handle previously.
  • The indets command, which finds the variables or subexpressions of a given type of an expression, is used extensively in both library and user code and is now significantly faster.
  • The frequently used commands coeffs and degree, which used to be quadratic in the number of variables, are now linear.
  • Modular arithmetic operations Expand, Quo, and Rem have been optimized.
  • Improvements to the extended Euclidean algorithm include an order of magnitude speed improvement for sparse structured problems.
  • Efficiency improvements mean sparse pseudo division can now handle larger problems and give more concise answers.
  • The iratrecon command for rational reconstruction has been re-engineered to improve performance.
  • The frontend command, which is used extensively by Maple to map expressions to the domain of rational functions, was rewritten to reduce time and memory usage.

Learn more...
Statistics and Data Analysis
  • Improved math editing now inserts an explicit multiplication symbol in certain cases, to help you avoid common errors in writing expressions and troubleshoot your work more quickly.
  • You can now insert a sequence or range of equation labels in one easy step using the equation label dialog.
  • You can now access the MapleCloud right from the worksheet toolbar, where you can log in, browse shared content, or check for updates on packages you've downloaded from the MapleCloud.
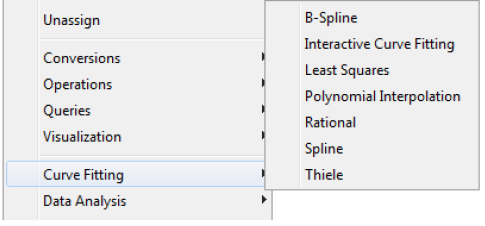
  • Many more operations are now available in the context menu, including signal processing operations and curve fitting options for two-column matrices and data frames.
  • New shortcut keys are available for interface zooming and help search.
  • It is now easy to have more than one help page open at the same time.

Learn more...
Statistics and Data Analysis

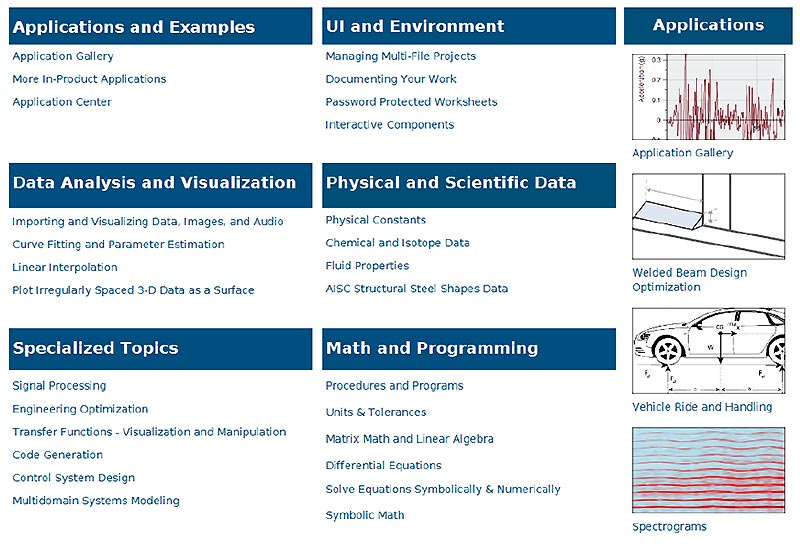
The Maple Portal for Engineers provides a starting point for common engineering tasks. The significantly updated Portal now covers many more topics, includes more examples, and provides sample applications to help you become productive quickly. It includes information on math and programming, interface features for managing your projects, data analysis and visualization tools, working with physical and scientific data, and a variety of specialized topics. It also includes links to dozens of sample applications and examples taken from many different branches of engineering.


Learn more...
Watch the video
Applications, Examples, and Math Apps
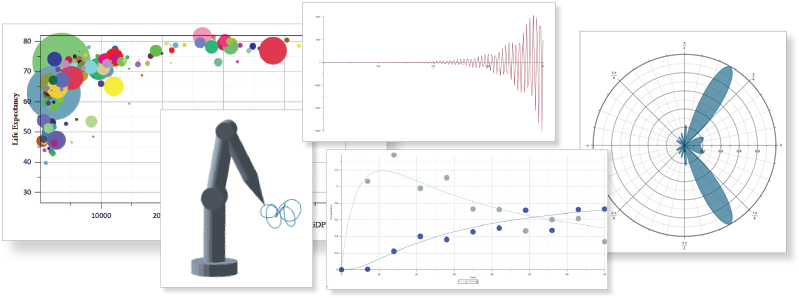
Maple 2017 includes over 30 new applications, examples, and Math Apps. Topics include a model of a robot arm with three degrees of freedom, applying filters to an audio file, finding the terminal velocity of a particle settling in a fluid, visualizing multiple data sets using bubble plots, modeling a two-wheeled suitcase using delay differential equations, and exploring world map projections.


Learn more...